Evaluating the Polluter Pays Principle Infographic for Environmental Policy Communication
Communicating complex environmental economic frameworks requires a balance of legal accuracy and visual clarity. The Polluter Pays Principle (PPP) is a foundational concept in international environmental law, yet explaining its operational mechanics to stakeholders often proves challenging. A dedicated Polluter Pays Principle infographic serves as a specialized visualization tool designed to bridge the gap between dense regulatory text and public understanding. Unlike generic environmental templates, these resources are structured specifically to illustrate liability, cost internalization, and remediation workflows. When evaluating whether to utilize a pre-designed vector template or commission custom work, professionals must consider the specific narrative requirements of their presentation, the technical depth required, and the intended audience's familiarity with tax system design elements.
Distinguishing Specialized PPP Visuals from Generic Environmental Templates
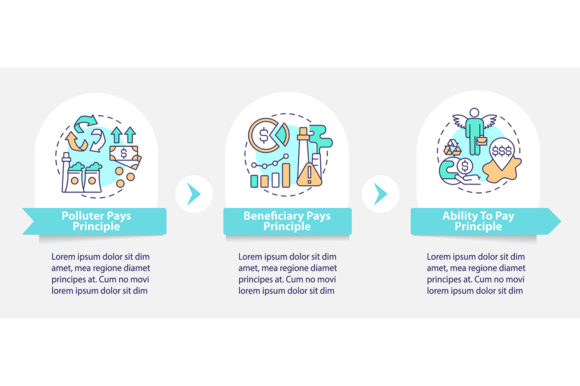
The primary distinction of a Polluter Pays Principle infographic lies in its focus on causality and financial flow rather than general ecological awareness. Generic environmental graphics typically emphasize conservation, recycling loops, or nature imagery. In contrast, PPP visualizations function more like economic diagrams or tax system presentations. They prioritize linear logic over cyclical metaphors because the principle itself is linear: pollution occurs, liability is assessed, and payment or remediation follows.
High-quality PPP templates incorporate specific data visualization techniques that mirror fiscal policy documents. This includes process timeline charts that map the chronological progression from emission detection to financial settlement. When comparing options, look for designs that utilize workflow layouts with linear icons. These icon sets should represent industrial sources, regulatory bodies, assessment mechanisms, and fund allocation. If a template relies heavily on leaves, globes, or abstract green shapes without clear directional flow, it likely lacks the structural integrity needed to explain the Polluter Pays Principle effectively. The distinct value of a specialized template is its ability to present the PPP not just as an ethical ideal, but as a functional administrative mechanism.
Analyzing the Three-Step Data Visualization Framework
Effective communication of this principle often hinges on a simplified three-step data visualization model. When reviewing potential assets, assess how well they articulate this triad, as it forms the core of most PPP explanations:
- Identification and Assessment: The first step visualizes the source of pollution and the metric used to quantify harm. Superior infographics provide space for variable data, such as carbon tonnage, effluent volume, or toxicity levels, rather than static placeholders.
- Liability Assignment and Pricing: This stage connects the physical act of pollution to economic consequence. Templates should offer clear visual connectors between the polluter and the taxing authority or affected party. This is where tax system presentation design elements become critical, requiring clean typography and grid alignment to display formulas or fee structures without clutter.
- Remediation and Revenue Allocation: The final step demonstrates where the funds go. Whether directed toward environmental restoration, victim compensation, or general treasury, the visual flow must close the loop. A strong workflow layout ensures the viewer understands that the payment is not merely punitive but restorative or redistributive.
When comparing different vector infographic templates, evaluate the flexibility of these three steps. Some designs hard-code specific examples that may not align with your jurisdiction or industry. Others provide modular components that allow you to swap out the "pricing" mechanism for a cap-and-trade system or a direct liability lawsuit model. The latter offers significantly higher long-term utility for researchers and consultants who work across multiple regulatory environments.
Vector Formats vs. Static Images: Technical Tradeoffs and Utility
The decision to acquire a comprehensive ZIP file containing EPS, JPG, PNG, SVG, and AI formats versus using a static image involves weighing immediate convenience against long-term adaptability. For professionals producing comparative research or policy briefs, vector formats (EPS, AI, SVG) are generally non-negotiable. The Polluter Pays Principle is subject to frequent legislative updates; tax rates change, thresholds adjust, and new pollutants are categorized. A raster-only format (JPG, PNG) becomes obsolete the moment data changes, requiring expensive redesigns or unprofessional editing artifacts.
Vector templates allow for infinite scaling without quality loss, which is essential when the same graphic must appear in a detailed white paper and a large-format conference poster. More importantly, editable vectors permit the modification of color palettes to match organizational branding or to adhere to accessibility standards for colorblind viewers. However, this flexibility comes with a tradeoff: a higher barrier to entry. Users must possess proficiency in Adobe Illustrator or compatible software like Inkscape or Affinity Designer. If your team lacks vector editing capabilities, the time investment to learn these tools may outweigh the cost savings of a template. In such cases, a high-resolution PNG might serve as a better interim solution, provided the data remains stable.
Comparing Workflow Layouts Against Circular Economy Models
A common point of confusion in resource selection is distinguishing between Polluter Pays visuals and Circular Economy diagrams. While both address sustainability, their underlying logic differs fundamentally. Circular Economy infographics emphasize closed loops, regeneration, and waste elimination. They are optimistic and systemic. PPP infographics, conversely, are corrective and transactional. They assume waste has already occurred and focus on managing the negative externality.
If your objective is to promote proactive sustainability strategies or product design innovation, a PPP-specific template may feel too punitive or reactive. Conversely, if you are analyzing compliance costs, environmental taxes, or legal liability frameworks, a circular economy graphic will fail to convey the necessary gravity and linearity. Professionals evaluating resources should ask whether their content focuses on prevention through design (favoring circular models) or accountability through regulation (favoring PPP models). There are hybrid approaches that combine both, showing how PPP revenues fund circular initiatives, but these require careful customization to avoid muddying the message. Standard PPP templates excel at the accountability aspect but may require significant adaptation to show positive reinvestment cycles.
Decision Factors for Researchers and Policy Analysts
Selecting the right visualization asset depends heavily on the maturity of your research and the specificity of your case study. Pre-made Polluter Pays Principle infographic templates are best suited for explanatory contexts where the goal is to define the concept or compare standard regulatory approaches. They provide a professional baseline that saves dozens of hours of conceptual drafting. For academic lectures, introductory policy briefs, or stakeholder education sessions, these templates offer an optimal balance of quality and efficiency.
However, there are scenarios where a template may be insufficient. If your analysis involves novel legal theories, multi-jurisdictional comparisons with conflicting frameworks, or highly specific industrial processes that lack standard iconography, custom illustration is often necessary. Templates rely on universal symbols; niche industries like rare earth mining or pharmaceutical waste disposal may not have representative icons in standard libraries. Furthermore, if your data visualization requires complex statistical overlays—such as regression analysis linking tax rates to emission reductions—a standard three-step process chart may be too reductive. In these instances, the template should be viewed as a starting point for layout inspiration rather than a final deliverable.
Evaluating Design Quality and Information Hierarchy
Not all vector templates are created equal. When browsing options, scrutinize the information hierarchy. Effective tax system presentation design elements guide the eye logically from left to right or top to bottom. Poorly designed templates often scatter text boxes arbitrarily or use decorative elements that compete with data. Check for consistent stroke weights in linear icons, adequate whitespace between process steps, and legible typography at reduced sizes. A visually crowded infographic undermines the clarity that the Polluter Pays Principle seeks to establish.
Additionally, verify the licensing terms included in the ZIP file. Commercial use rights vary significantly. Some templates restrict usage to digital presentations only, prohibiting inclusion in printed reports or commercial publications. For consultants and advisors who produce client-facing deliverables, ensuring broad commercial licensing is as important as the aesthetic quality. The presence of multiple file types (AI, EPS, SVG) usually indicates a professional-grade asset intended for serious use, whereas packages offering only flattened PDFs or low-res images often signal lower quality or restrictive usage terms.
Practical Application and Integration Strategies
To maximize the value of a Polluter Pays Principle infographic, integrate it thoughtfully within your broader narrative. Use the three-step visualization as an anchor slide in presentations, allowing you to verbally elaborate on each phase while the audience maintains visual context. In written reports, place the workflow layout adjacent to the relevant regulatory text to reduce cognitive load. When comparing multiple policy options, consider using a series of modified PPP infographics side-by-side to highlight differences in liability thresholds or revenue destinations. This comparative approach leverages the template’s consistency to make variations immediately apparent.
Ultimately, the choice to use a specialized infographic template reflects a commitment to precision in environmental communication. By selecting resources that respect the linear, economic nature of the Polluter Pays Principle, professionals can avoid the pitfalls of generic eco-design. Whether utilizing a ready-made vector asset or adapting one for specific needs, the goal remains constant: transforming abstract legal obligations into clear, actionable visual intelligence. Evaluating these tools through the lens of functional fit, technical flexibility, and narrative alignment ensures that the chosen resource enhances rather than distracts from the critical work of environmental policy analysis.