Evaluating the Job Transition Reasons Infographic for Professional Data Storytelling
Visualizing workforce dynamics requires more than standard bar charts or pie graphs. When organizations analyze why employees leave, they are dealing with qualitative narratives, sequential decision-making processes, and complex emotional drivers. A specialized Job Transition Reasons Infographic serves as a dedicated visual framework designed to map these non-linear human experiences into structured, digestible data. Unlike generic business templates, this specific design category focuses on the causality and timeline of departure, transforming exit interview data and retention analytics into actionable strategic insights.
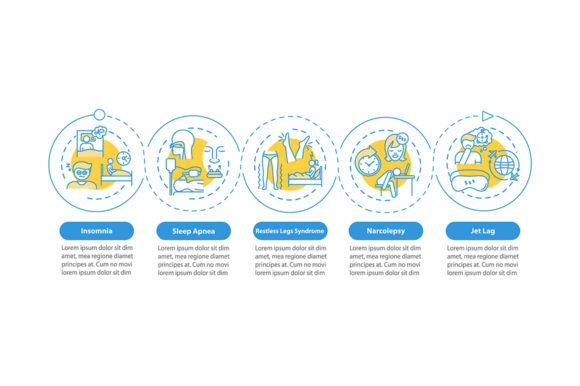
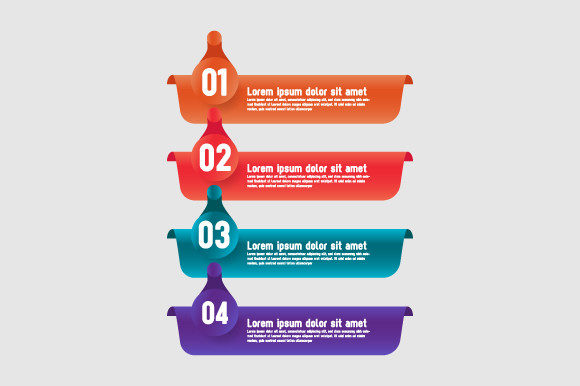
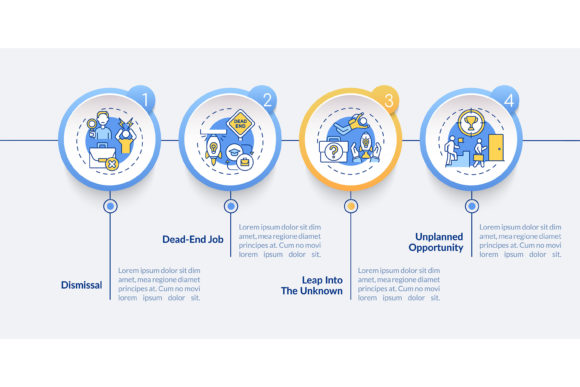
The distinct value of this infographic type lies in its structural approach to sensitive information. It typically employs a four-step process timeline or a linear workflow layout to illustrate the progression from initial dissatisfaction to final resignation. This format moves beyond static statistics to show the journey of attrition. For HR professionals, department heads, and organizational consultants, selecting the right template involves understanding how different vector formats and design layouts influence stakeholder perception and data clarity.
Distinguishing Specialized Transition Visuals from Generic HR Templates
When comparing resources for presenting turnover data, it is necessary to differentiate between general employee engagement infographics and those specifically engineered for transition reasons. General HR templates often focus on positive metrics like satisfaction scores, benefits utilization, or hiring funnels. While useful for broad overviews, they frequently lack the narrative depth required to explain why talent exits.
A dedicated Job Transition Reasons Infographic differs in three critical areas:
- Causal Sequencing: Instead of isolated data points, these designs utilize process timeline charts to connect triggers (e.g., management changes, compensation stagnation) to outcomes. This helps viewers understand attrition as a cumulative process rather than a sudden event.
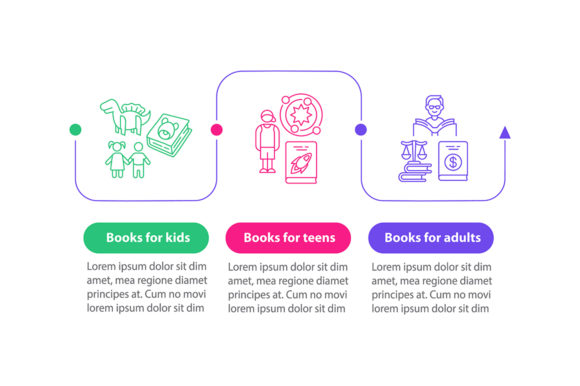
- Tone and Iconography: The visual language is calibrated for professional neutrality. Linear icons and muted color palettes replace celebratory graphics, ensuring the presentation remains respectful and analytical when discussing potentially negative organizational feedback.
- Data Density Management: These templates are structured to handle mixed-method data. They provide designated spaces for both quantitative percentages (e.g., "30% cited salary") and qualitative context (e.g., "Lack of remote work options"), which is essential for comprehensive exit analysis.
If your goal is to celebrate company culture or outline onboarding procedures, a general HR template is likely sufficient. However, if the objective is to diagnose retention failures or present exit survey findings to executive leadership, the specialized structure of a transition-focused infographic provides a more appropriate and effective vessel for the data.
Analyzing Format Flexibility: Vector vs. Raster Deliverables
The utility of an infographic template is heavily dependent on its file architecture. When evaluating Job Transition Reasons Infographic packages, understanding the tradeoffs between available file types—JPG, PNG, EPS, SVG, and AI—is crucial for long-term usability and cross-platform compatibility.
Vector Formats (AI, EPS, SVG)
For professional presentations and reports that may require future updates, vector-based files are generally the superior choice. Adobe Illustrator (AI) and Encapsulated PostScript (EPS) files allow for infinite scaling without quality loss, making them ideal for everything from slide decks to large-format printed posters. More importantly, they offer full editability. If your organization’s branding colors change or if you need to adjust the four-step process to a five-step model next quarter, vector files permit direct manipulation of nodes, paths, and text layers.
SVG (Scalable Vector Graphics) has emerged as a vital middle ground. It offers the editability of vectors but is code-based and web-native. If your transition data needs to be embedded in an internal intranet, digital annual report, or interactive dashboard, SVG ensures crisp rendering on all screen sizes while maintaining a small file footprint.
Raster Formats (JPG, PNG)
JPG and PNG files serve a different purpose. They are finalized outputs rather than editable sources. These formats are best suited for immediate distribution where modification is not anticipated, such as email newsletters or quick social media updates. PNG supports transparency, which can be useful when overlaying the infographic onto colored backgrounds in presentation software. However, relying solely on raster formats limits adaptability. If new data emerges requiring a chart update, users without the original source files must recreate the graphic entirely.
Decision Factor: Prioritize packages that include AI or EPS master files alongside PNG/JPG exports. This ensures you have immediate-use assets for today’s meeting and editable masters for next year’s trend analysis.
Structural Fit: When to Use Process Timelines vs. Alternative Layouts
Not all attrition data fits a linear narrative. While the four-step process timeline is a hallmark of the Job Transition Reasons Infographic, it is important to evaluate whether this structure aligns with your specific dataset. Comparing this layout against alternative visualization methods helps prevent forcing complex data into an incompatible container.
Best Fit for Linear Workflow Layouts
The linear icon workflow excels when illustrating the chronological stages of employee disengagement. Research suggests that leaving a job is rarely impulsive; it follows a psychological trajectory. If your data captures this evolution—for example, Stage 1: Role Ambiguity, Stage 2: Failed Interventions, Stage 3: External Market Scanning, Stage 4: Resignation—the timeline format is highly effective. It validates the employee experience as a process and highlights specific intervention points where retention efforts could have succeeded.
When to Consider Alternatives
If your primary data consists of independent, non-sequential categories (e.g., comparing salary vs. commute vs. culture across different departments), a linear timeline may imply a false causality. In such cases, a comparative matrix, radial diagram, or segmented bar chart might offer greater accuracy. Similarly, if the data is overwhelmingly quantitative with little narrative component, a traditional statistical dashboard may communicate the findings more efficiently than an illustrative infographic.
Furthermore, consider the volume of data points. The four-step model works best when synthesizing high-level themes. If you need to display twenty distinct reasons for leaving, a linear workflow will become cluttered and illegible. In high-density scenarios, hierarchical tree maps or heat maps are often better alternatives for pattern recognition.
Evaluating Design Elements for Stakeholder Communication
The aesthetic choices within a Job Transition Reasons Infographic significantly impact how the message is received by different audiences. When comparing templates, look beyond visual appeal and assess how design elements support communication goals.
Iconography Style: Linear icons are currently the industry standard for professional B2B and internal corporate communications. They convey modernity and cleanliness without the visual weight of filled or 3D illustrations. Filled icons can sometimes appear too playful or juvenile for serious discussions about workforce stability. Conversely, overly abstract icons can create cognitive load, forcing viewers to decipher symbols rather than absorb insights. Evaluate templates based on icon clarity and semantic consistency.
Color Psychology: Effective transition infographics avoid aggressive reds or alarming contrasts that might trigger defensiveness in management audiences. Balanced templates often use cool blues, teals, or neutral grays to maintain an objective, analytical tone. Accent colors should be used sparingly to guide the eye through the four steps or highlight critical data points, not to decorate. Compare color schemes against your organization’s accessibility standards to ensure readability for all stakeholders.
Typography Hierarchy: Data visualization fails if the text competes with the graphics. High-quality templates establish a clear typographic hierarchy: bold headers for stages, medium weight for key metrics, and lighter weights for explanatory notes. Test sample templates at actual presentation size. If the supporting text becomes unreadable when projected on a screen or viewed on a tablet, the design lacks practical utility regardless of its aesthetic merit.
Making the Final Selection Based on Organizational Needs
Choosing the right Job Transition Reasons Infographic ultimately depends on balancing immediate presentation needs with long-term analytical flexibility. For teams conducting one-off exit analyses or external benchmarking reports, a polished PNG or JPG with a strong linear narrative may suffice. These resources save time and provide instant professional credibility.
However, for organizations building a continuous retention strategy, investing in fully editable vector templates (AI/EPS/SVG) is the more prudent choice. The ability to customize the four-step process, update linear icons to match evolving brand guidelines, and adapt the workflow layout as new research emerges transforms a static graphic into a living strategic tool.
Consider also the integration with existing workflows. Does the template’s aspect ratio fit your standard slide deck? Do the font families match your corporate style guide, or will reformatting require significant design hours? A template that requires extensive modification negates the efficiency benefits of using pre-made assets.
By carefully weighing format versatility, structural appropriateness, and tonal alignment against your specific data characteristics, you can select a visualization resource that does more than display information. The right Job Transition Reasons Infographic facilitates understanding, reduces defensive reactions to negative feedback, and ultimately supports evidence-based decisions to improve organizational health. Whether utilizing a simple timeline or a complex multi-stage workflow, the goal remains consistent: translating individual departure reasons into collective organizational learning.